
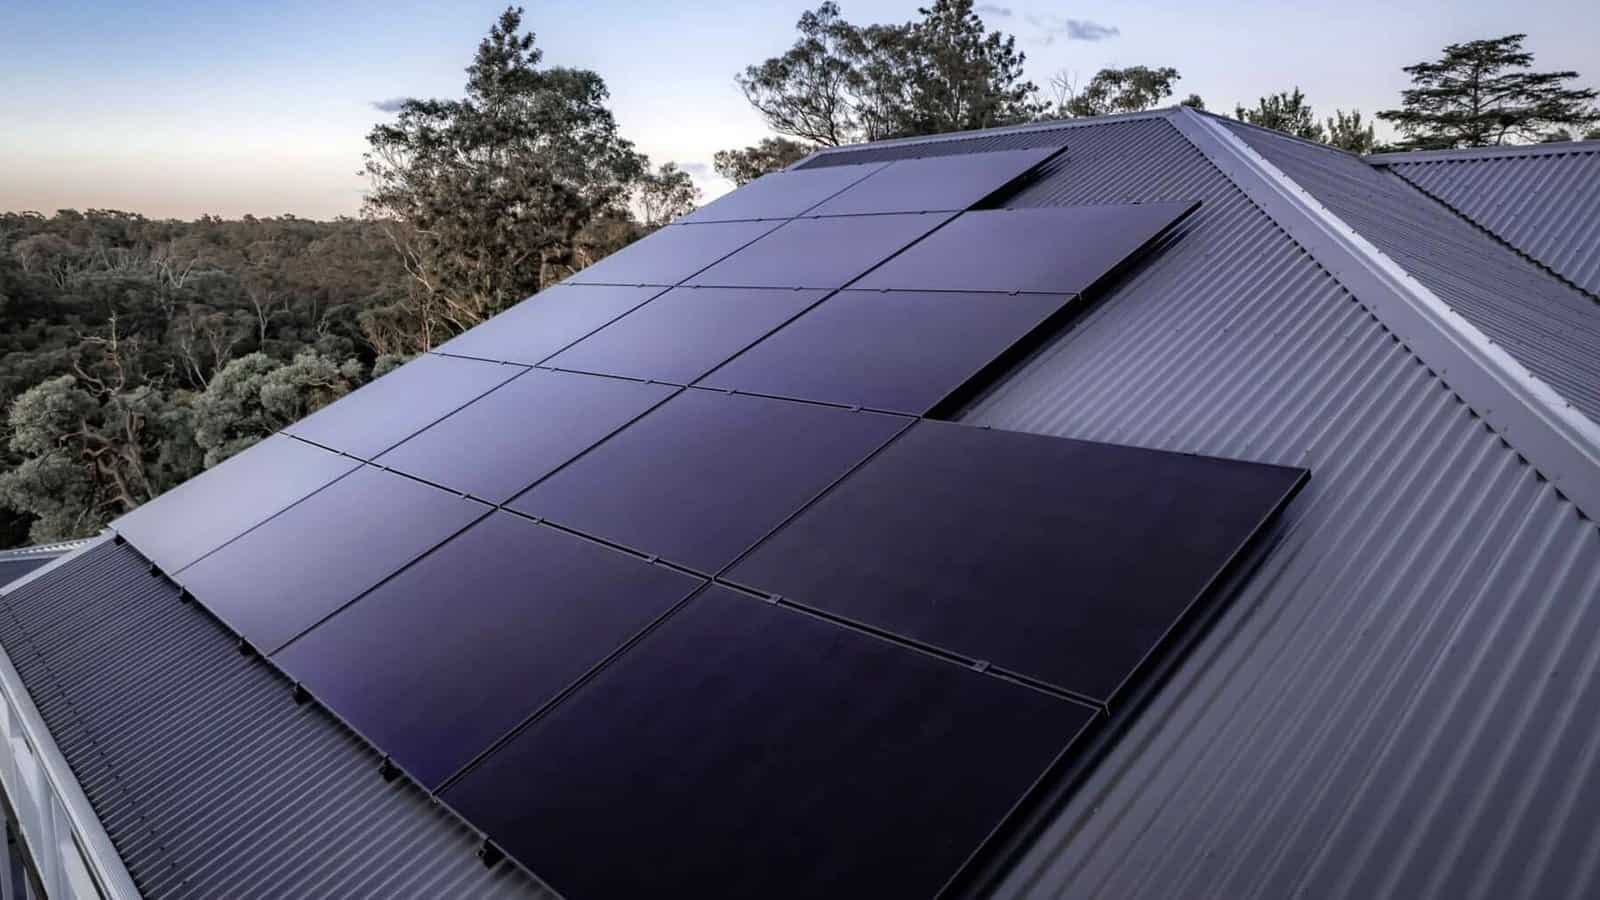
Start with an uncomfortable statistic. The EU’s rooftops generated roughly 410 TWh of solar electricity in 2025. Official EU statistics recorded only 275 TWh.[1] A gap of over 135 TWh — one-third of actual output — is simply missing from the books.
That gap has a structural explanation. It also has a strategic implication: EU rooftop PV is more mature, more distributed, and more consequential than any official dataset currently captures. The policy framework is already responding. So is the module technology.
This guide covers what procurement teams and specifiers actually need to know: the market facts, the regulatory obligations with correct dates, and a rigorous technology comparison — including where back-contact modules genuinely outperform the alternatives, and where they do not.
The Hidden Data: Why EU Rooftop PV Output Is 33% Larger Than Official Statistics Show
SolarPower Europe’s head of market intelligence, Raffaele Rossi, identified three structural reasons why grid operator data systematically undercounts rooftop PV output.
Registration gaps. Millions of small residential systems are never fully captured in local grid operator registries. Data then moves to national statistics with additional delays at every step.
Invisible self-consumption. Electricity generated and used on-site never crosses the grid. Conventional statistics cannot see it. With battery storage now paired to a high proportion of distributed installations, the invisible share is growing.
Net-only metering. Most smart meters record the difference between import and export — not gross solar generation. Even dense smart meter coverage therefore leaves rooftop output largely invisible in official figures.
The result: Europe’s energy transition is further along than the official picture suggests — and the case for rooftop solar investment is stronger than published numbers imply.
Market Reality Check: 406 GW Installed, 750 GW Target at Risk
EU solar capacity reached 406 GW by end of 2025, meeting the bloc’s own 2025 milestone.[2] The formal 2030 target is 750 GWdc (600 GWac) under the REPowerEU Solar Energy Strategy.[3] That target is now at risk: SolarPower Europe’s most likely 2030 scenario reaches only ~718 GW, with annual additions declining through 2026–2027 before recovery in 2028–2029.[4]
Rooftop systems account for approximately two-thirds of EU cumulative installed solar capacity. The JRC estimates the long-term EU rooftop technical potential at 1.1 TW under conservative assumptions.[5] Residential rooftop solar fell from 28% of annual EU additions in 2023 to 14% in 2025 as support schemes were cut and energy price anxiety eased.[6] Commercial and industrial (C&I) rooftops are now the segment with structural momentum — larger areas, stronger daytime demand alignment, and better economics as feed-in income shrinks.
The slowdown is real but cyclical. The EPBD mandate creates a demand floor that market fluctuations cannot erase.
The EPBD Solar Mandate: Exact Timelines EU Building Owners Cannot Afford to Misread
The revised Energy Performance of Buildings Directive (EPBD, EU/2024/1275), which entered into force on 28 May 2024,[7] creates a legally binding, staggered solar programme. These are the correct dates:
| Building Category | Obligation | Deadline |
|---|---|---|
| All new buildings | Solar-ready structural design — not yet installation | 29 May 2026 |
| New non-residential & public buildings >250 m² | Solar panels installed | 1 Jan 2027 |
| Existing non-residential buildings: major renovation | Solar panels installed | 2028 |
| New residential buildings | Solar panels installed | 2030 ✱ |
| All suitable existing public buildings | Solar panels installed | 2031 |
✱ Frequently misquoted. The residential installation mandate is 2030, not 2029. The 2026 obligation is a structural design requirement only — panels do not need to be installed immediately, but the building must be engineered to receive them.
SolarPower Europe estimates full EPBD implementation could drive an additional 150–200 GW of EU rooftop capacity between 2026 and 2030, primarily from large commercial rooftops, schools, hospitals, offices, and car parks.[8]
Six Things Buyers Get Wrong When Specifying Rooftop Solar Modules
These are the specification and procurement errors that appear most consistently across EU rooftop projects. Each one costs money, either at procurement or over the system lifetime.
Comparing solar modules on STC wattage alone
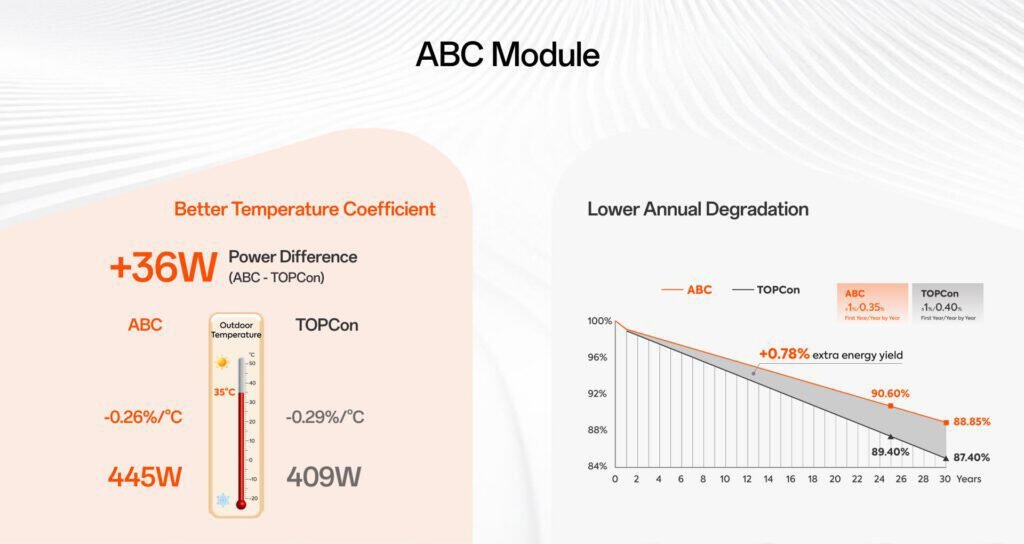
Standard Test Conditions (STC) measure output at 25°C cell temperature and 1,000 W/m². Real rooftops operate at 45–70°C cell temperature on sunny days. A module’s temperature coefficient tells you how much of that nameplate wattage actually materialises on a hot July afternoon. A BC PV module at 60°C cell temperature retains approximately 90.9% of rated output. The equivalent TOPCon retains 89.5%. PERC retains roughly 86.7%. The STC comparison alone would not reveal this difference.
Ignoring the balance-of-system cost offset
A higher-efficiency solar module means fewer panels for the same target output. On a constrained commercial rooftop, fewer panels means fewer mounting rails, fewer roof penetrations, less DC cabling, and less labour. That BOS saving can partially — sometimes fully — offset the module price premium. Evaluate on installed cost per kWh generated over 25 years, not module cost per watt at purchase.
Over-specifying shade mitigation hardware on BC systems
Microinverters and DC optimizers are sometimes blanket-specified on every rooftop project “for shade.” On a BC system in a light-shading environment, this can be redundant. BC’s back-contact architecture includes internal current management that bypasses narrow shaded areas without activating bypass diodes — providing cell-level shade resilience. Conduct a shading analysis first; specify optimizers where the analysis shows full-row shading, not as a universal default.
Assuming all “all-black” panels are visually equivalent
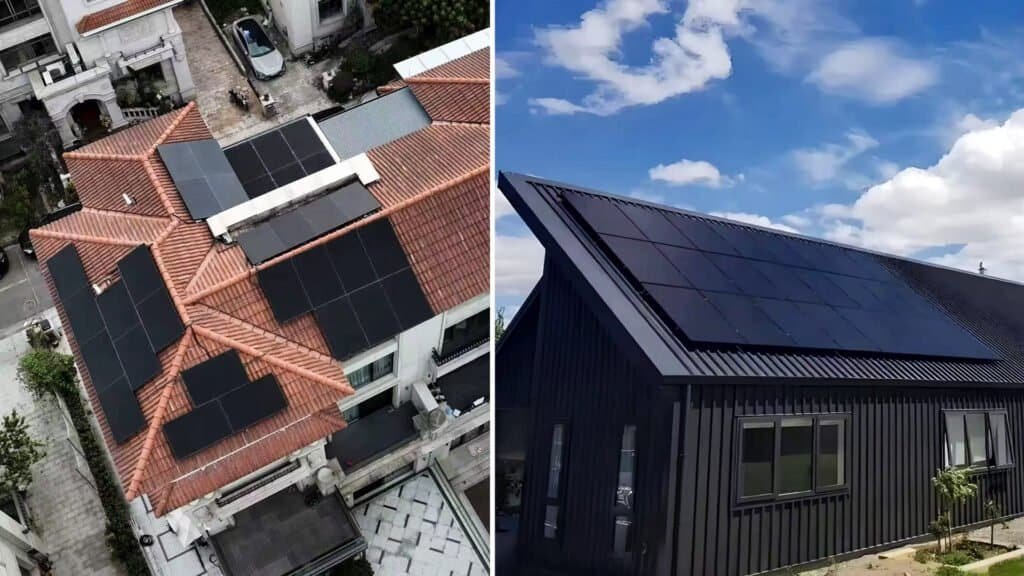
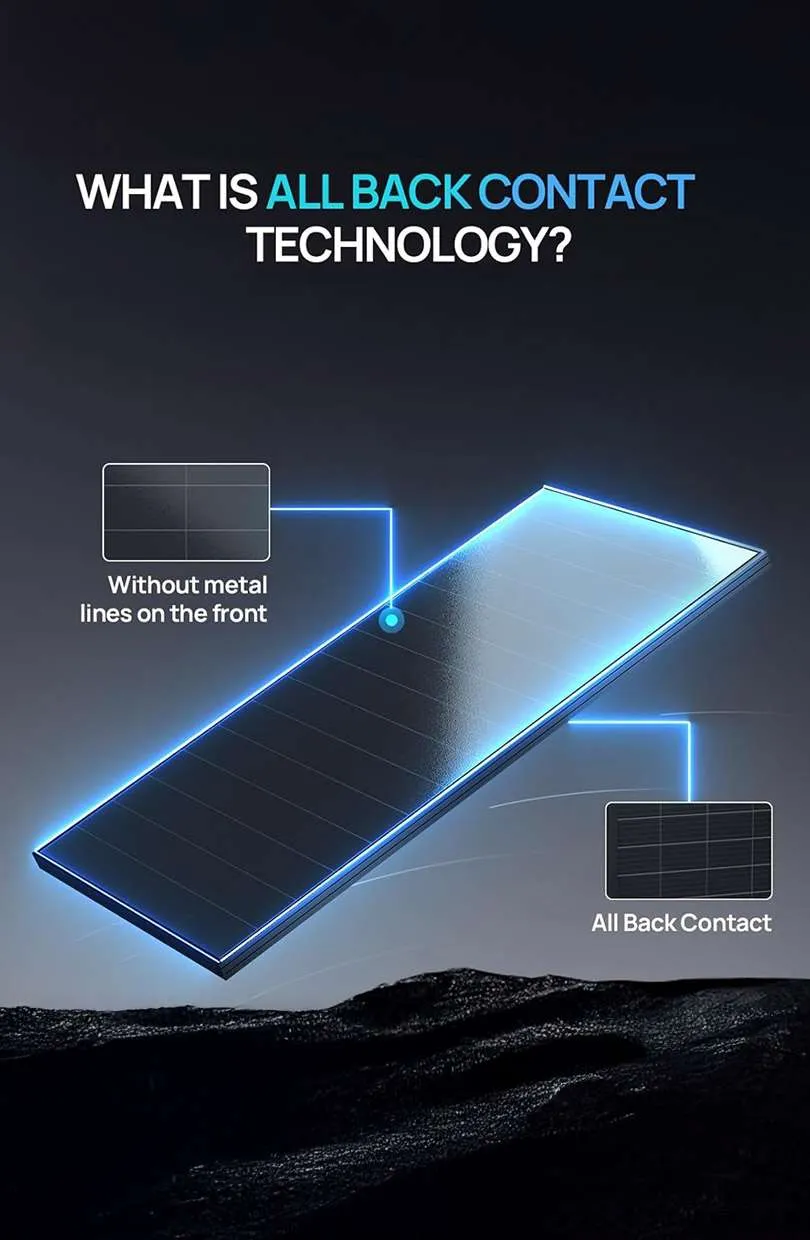
Conventional solar panels with black backsheets and black frames are “all-black” by marketing description — but their front gridlines remain visible on close inspection. BC panels have no front metallization: the surface is completely uniform. In heritage zones, conservation areas, or planning applications requiring minimal visual impact, this distinction can be the difference between approval and refusal.
Reading the warranty headline without reading the linear power clause
A “25-year product warranty” headline tells you almost nothing. What matters is the linear degradation schedule: the percentage of rated output guaranteed at years 10, 20, and 25. A guarantee of ≥92% at year 25 is meaningfully different from ≥80%. N-type BC typically degrades at ≤0.40% per year; quality TOPCon at 0.40–0.45%; PERC at 0.45–0.55%.[9] Over 25 years, that 0.1–0.15% annual difference compounds into approximately 2.5–3.75% more retained capacity — equivalent to an extra panel’s worth of output for free.
Treating the EPBD mandate as a future problem
Building permit applications submitted from 29 May 2026 must already include solar-ready structural design. Projects being designed now fall within this window. Leaving solar specification to a later construction phase means costly structural modifications or non-compliance. The time to integrate the solar brief is in the architectural design stage, not at handover.
BC vs. TOPCon vs. PERC: A Technical Comparison for EU Procurement Teams
Data current as of mid-2026. TOPCon has closed the efficiency gap at the mass-production level — both BC and leading TOPCon modules now reach 24.8% in volume production. The differentiation between BC and TOPCon is therefore increasingly architectural and operational, not purely numerical. Always verify against specific manufacturer datasheets and third-party test reports before finalising specifications.
| Parameter | BC (HPBC / ABC / IBC) | TOPCon (N-type) | PERC (P-type) |
|---|---|---|---|
| Commercial module efficiency | 23.5 – 25.0%[10] | 22.5 – 24.8%[11] | 20.0 – 21.5% |
| Certified module record | 25.4% (Fraunhofer ISE)[12] | 25.58% (TÜV SÜD)[13] | ~23.6% (certified) |
| Cell lab record | 27.81% HIBC (ISFH)[14] | 27.79% (ISFH)[13] | ~24.5% (certified) |
| Temp. coefficient Pmax | −0.26 to −0.30%/°C | −0.29 to −0.32%/°C | −0.35 to −0.40%/°C |
| Output retained at 60°C cell temp | ~90.9% | ~89.5% | ~86.7% |
| Front metallization | None — rear contact only | Front busbars (MBB) | Front busbars (MBB) |
| Shade resilience — narrow/isolated | Excellent (internal bypass)[15] | Moderate | Basic |
| Shade resilience — full-row shading | Similar to TOPCon[16] | Moderate | Basic |
| Gridline-free front surface | Yes — completely uniform | No (gridlines visible) | No (gridlines visible) |
| LeTID degradation risk | Very low (N-type) | Very low (N-type) | Moderate (P-type) |
| Typical annual degradation | ≤0.40%/year | 0.40–0.45%/year | 0.45–0.55%/year |
| Price premium vs. PERC (approx.) | +35–50% | +10–20% | Baseline |
| BIPV suitability | Excellent | Moderate | Poor |
| Best-fit application | Space-constrained rooftops, premium residential, BIPV, premium C&I | Large C&I, utility, cost-sensitive residential | Budget residential, legacy replacement |
Sources: Aiko Solar (April 2026, TaiyangNews); JinkoSolar/pv-tech (June 2025); LONGi (Fraunhofer ISE); Clean Energy Reviews (2026); ITRPV 2025; Trina Solar/Nanchang University, ScienceDirect (2025).
Five Engineering Reasons Back-Contact Technology Is Well-Suited to EU Rooftop Conditions
1. Efficiency advantage is architectural, not just numerical
Conventional solar cells lose 3–5% of incoming light because metal busbars cross the front surface. BC cells eliminate this loss entirely — no front metallization means more photons reach active silicon at every irradiance level. As of mid-2026, leading BC modules reach 25.0% efficiency in mass production (Aiko ABC, April 2026; TÜV Nord confirmed)[10], with the certified module record at 25.4% (LONGi HPBC 2.0, Fraunhofer ISE).[12]
It is worth noting that leading TOPCon modules have now also reached 24.8% in mass production (JinkoSolar Tiger Neo 3.0, late 2025) with a certified module record of 25.58% (TÜV SÜD).[13] The cell-level lab records for both technologies are near-identical: BC at 27.81% (HIBC, ISFH)[14] and TOPCon at 27.79% (ISFH).[13] The honest picture: at the leading edge of production, BC and TOPCon are efficiency peers. BC’s rooftop advantage lies in its architecture — no front busbar shading, better Tc, and genuine gridline-free aesthetics — not a straightforward efficiency lead.
2. The temperature coefficient — a number worth calculating, not just citing
BC modules (HPBC 2.0) carry a temperature coefficient of −0.26%/°C, versus −0.29 to −0.32%/°C for TOPCon and −0.35 to −0.40%/°C for PERC.[17]
3. Shade resilience — what the peer-reviewed data actually says
Under TÜV Rheinland testing, HPBC 2.0 modules maintained hotspot temperatures of approximately 100°C versus over 160°C for TOPCon under identical point-shading — a peak difference of 77°C.[15] LONGi’s Hi-MO X10 received TÜV Rheinland’s A+ anti-shading rating in June 2025 and the industry’s first CPVT Three-Proof certification in September 2025.
⚠ Peer-reviewed nuance (ScienceDirect, August 2025): A study by Trina Solar researchers and Nanchang University found BC modules outperform TOPCon only when fewer than three cells in a substring are shaded.[16] For narrow, isolated shadows — cables, bird droppings, antenna elements — BC’s internal bypass is clearly better. For full-row shading from chimneys, eaves, or ridge lines, BC and TOPCon perform comparably. Always conduct a shadow analysis before concluding that BC technology alone eliminates shading losses.
4. True gridline-free aesthetics open BIPV and planning-sensitive markets
The front surface of a BC module has no front metallization — no busbars, no gridlines. The result is a genuinely uniform black surface, not a conventional all-black panel with faint visible wiring. For residential rooftops in heritage zones, commercial buildings with aesthetic specifications, and BIPV projects integrating PV into façades and roof tiles, this distinction directly affects planning approval and client acceptance. The EPBD mandate is already driving architects toward BIPV solutions; BC’s power density and uniform surface make it the technically correct choice for custom module formats and architectural integration.
5. Lower annual degradation means the yield gap widens over time
N-type BC modules are largely immune to Light and Elevated Temperature Induced Degradation (LeTID) — a mechanism that measurably reduces output in P-type PERC systems over the first years of operation. Combined with degradation rates of ≤0.40%/year versus 0.45–0.55%/year for PERC, BC modules maintain a widening yield advantage over a 25-year system life. On a 30-panel C&I system, the difference between 0.40% and 0.50% annual degradation yields approximately 3.75% more retained capacity at year 25 — equivalent to running an extra panel of output in the system’s final years.
Where Back-Contact Technology Falls Short: An Honest Assessment
Any technology assessment that only lists advantages is sales material, not engineering guidance.
BC modules carry a 10–30% price premium over comparable TOPCon and 30–50% over PERC. This narrows the addressable market to projects where efficiency, space, or aesthetics justify the additional capital. Budget-constrained residential and utility-scale projects should evaluate TOPCon as the rational baseline.
BC represented only approximately 1.7% of global solar cell shipments in 2025, versus TOPCon at ~88%, according to InfoLink Consulting.[18] Active volume manufacturers are primarily LONGi (HPBC) and Aiko (ABC). For large projects requiring long-term supply continuity, verify your supplier’s production scale and European logistics capability before committing.
IBC, HPBC, ABC, and HIBC are meaningfully different designs. HPBC 2.0 combines back-contact structure with TOPCon passivation — a hybrid, not a pure IBC cell. ABC uses a different contact architecture with different manufacturing economics. Performance, cost structure, and long-term roadmaps vary. “Back-contact” on a datasheet does not guarantee a specific performance tier without architecture verification.
Black glass and black backsheets absorb more solar heat than conventional silver or white alternatives, running cells 2–3°C hotter than comparable panels with reflective backsheets. This partially offsets the BC temperature coefficient advantage. Account for this in mounting design and ensure adequate ventilation gap for flush-mounted or BIPV applications.
Per the 2025 Trina/Nanchang peer-reviewed study, BC’s shade advantage over TOPCon applies specifically to narrow shading patterns (fewer than 3 cells per substring). Wide structural shadows from eaves, chimney stacks, or ridge lines perform comparably between BC and TOPCon. For these scenarios, string design and optimizer specification matter more than cell technology.
Specification Checklist: What to Verify Before Committing to BC Modules
NOCT efficiency and temperature coefficient. Request NOCT output explicitly. Target Pmax coefficient ≤ −0.30%/°C for standard rooftop work; ≤ −0.26%/°C for flush-mounted or southern European installations.
Shadow analysis first. Confirm shading patterns on the specific roof before specifying BC technology for shade mitigation. If full-row shadows dominate, BC’s shade advantage is limited and string design matters more.
Bifaciality factor and mounting clearance. Confirm whether bifacial gain is achievable given your roof surface and mounting height — and whether the ventilation gap is sufficient to offset the all-black thermal absorption increase.
IEC 61215 (performance) and IEC 61730 (safety) — mandatory for EU grid connection. Confirm these cover the exact SKU being ordered, not just a similar model.
CE marking and national grid approval documentation. IEC certification does not automatically satisfy every EU member state’s grid operator registration requirements.
Independent anti-shading test certificate — TÜV Rheinland, TÜV Nord, CPVT, or equivalent. Request the actual certificate, not the marketing claim, and verify it covers the specific module model.
Linear power warranty schedule. Minimum benchmark: ≥97.5% at year 1, ≥92% at year 25. Request the full year-by-year curve, not just the headline 25-year figure.
Manufacturer’s EU warranty servicing capability. A 25-year warranty is only as good as the manufacturer’s ability to honour it in Europe. Verify European service operations, not just EU distribution agreements.
EPBD solar-ready documentation. For projects with permits from 29 May 2026, confirm the supplier can provide the technical documentation required for building permit sign-off under EPBD solar-ready design requirements.
Long-Term Economics: LCOE, the Cost Gap, and a 25-Year Lens
EU homeowners typically expect payback in 6–10 years. A residential system (6–15 kWp) costs roughly €7,000–€40,000 installed, depending on specification and country. As feed-in income has shrunk, self-consumption now drives the ROI case more than export earnings.
BC modules carry a 10–30% price premium over comparable TOPCon products today. The LCOE calculation over 25 years tells a more nuanced story: LONGi’s HPBC 2.0 technical white paper reports a 4% lower LCOE than TOPCon over the system lifetime — a manufacturer-sourced figure, not yet independently verified, but mechanically consistent with certified field data on yield, degradation, and hotspot performance.
The premium is narrowing. As manufacturing scales and early IBC patent protections expire, industry estimates suggest cost parity with TOPCon could emerge by 2028–2030 — a projection, not a guarantee, but consistent across technology roadmaps.
The procurement framing: At the module level, BC is more expensive today. At the system level — fewer panels, less BOS hardware, lower degradation, reduced hotspot risk, and better performance in heat and narrow shading — the gap narrows substantially. For a 25-year commitment on a space-constrained rooftop, evaluate on installed LCOE and total yield, not module cost per watt at purchase.
The Bottom Line for EU Rooftop Procurement in 2026
EU rooftop solar is producing roughly one-third more electricity than official data shows. The EPBD mandates are creating a non-negotiable demand base starting in 2027 for commercial buildings and 2030 for residential. The market is entering a compliance-driven phase — one where module performance over 25 years matters more than module price per watt at procurement.
Back-contact is not the answer for every project. At the mass production level, BC and TOPCon are now efficiency peers at 24.8%. For cost-sensitive residential buyers and large utility work, TOPCon remains the rational baseline. But for space-constrained rooftops, premium residential systems, BIPV architecture, C&I buildings with aesthetic specifications, and projects in planning-sensitive zones, BC’s combination of gridline-free surfaces, certified shade resilience, lower degradation, and N-type LeTID immunity addresses the full specification that a European rooftop installation actually demands.
Europe’s rooftops are an underestimated power plant. The question for 2026 is not whether to put solar on them — the law is answering that. The question is what you put on them and how you specify it.
About Couleenergy’s BC Module Range
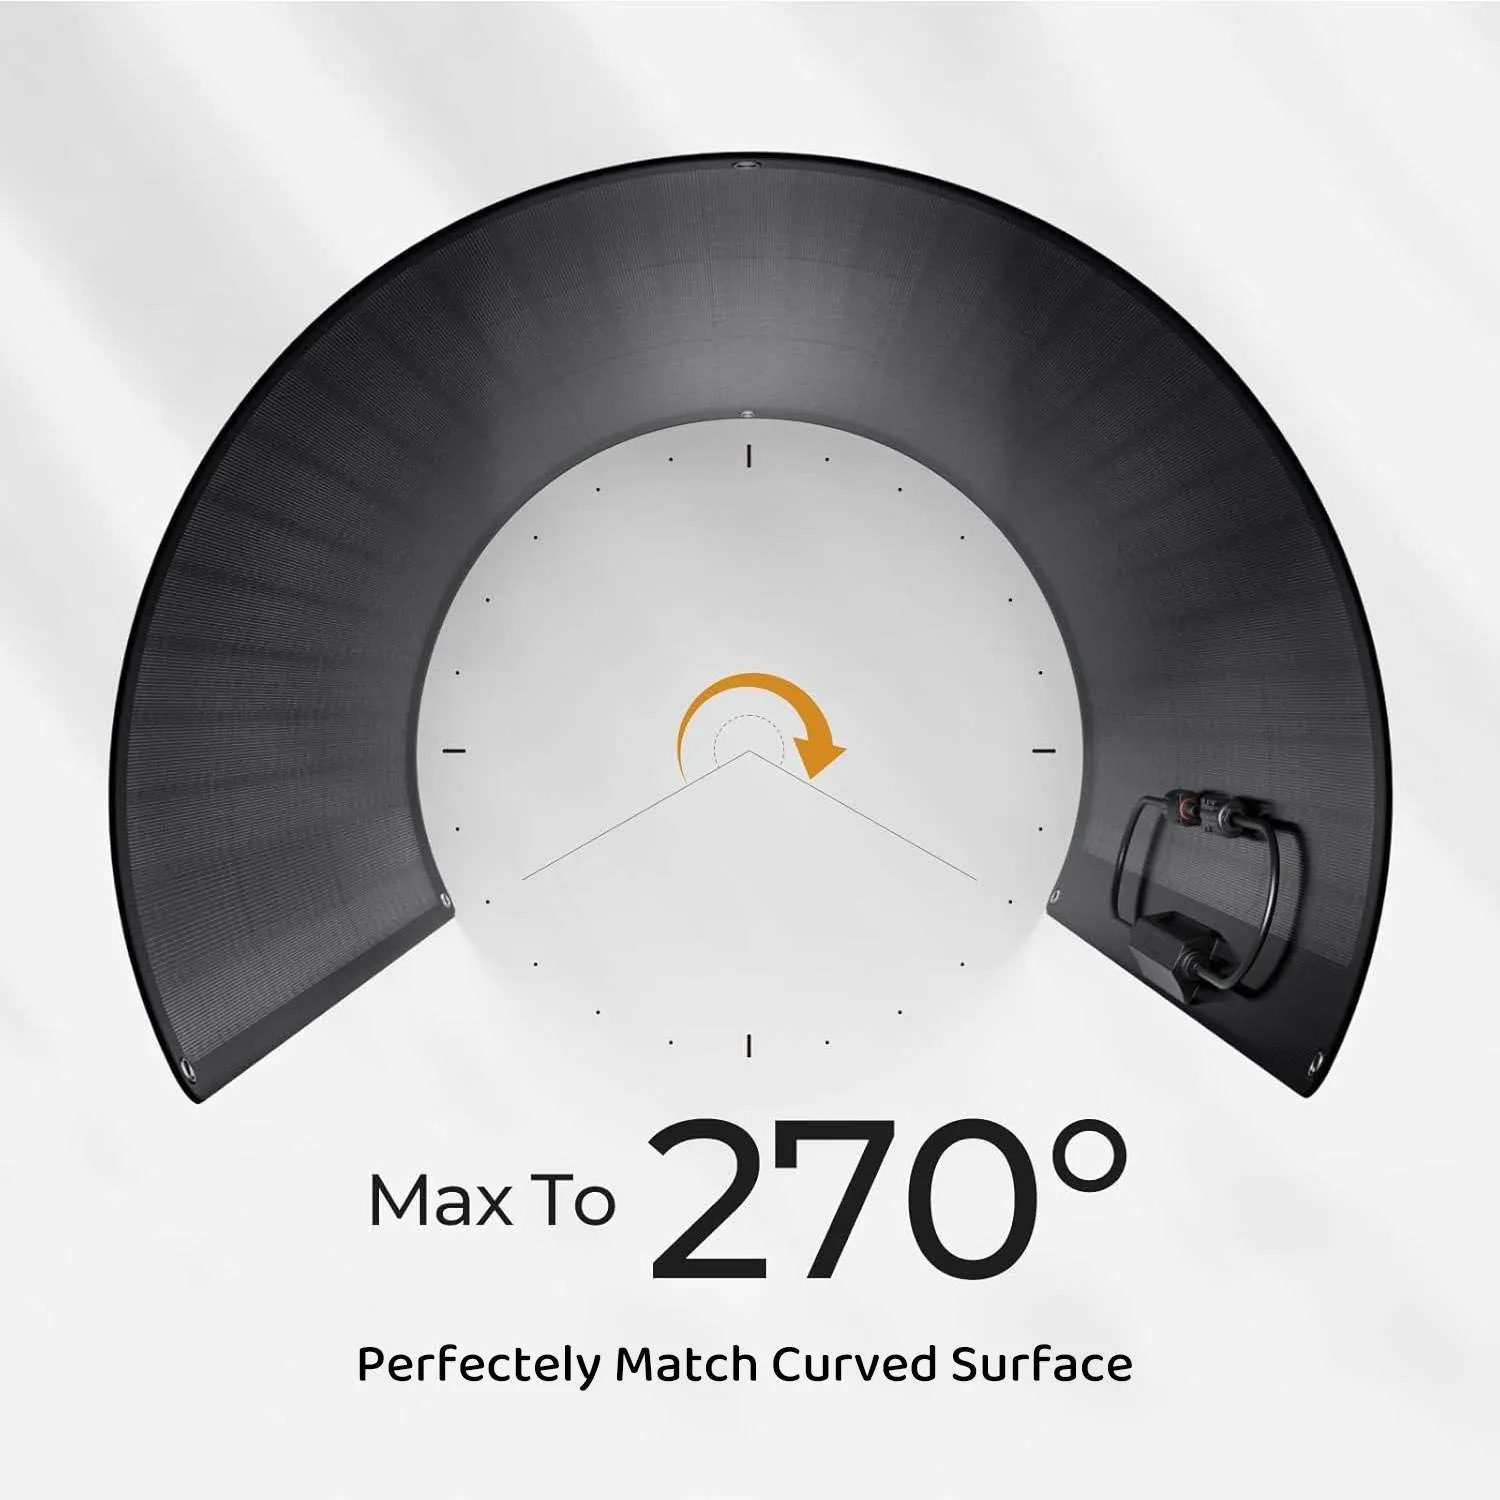
Couleenergy (Ningbo Coulee Tech Co., Ltd.) manufactures back-contact solar modules — including HPBC 2.0 and ABC/IBC formats — alongside flexible ETFE solar panels and BIPV solutions for EU and North American markets. Our BC modules are available with MOQs from 100 units and are designed to meet your specification requirements.
For product datasheets, sample requests, or project-specific technical consultation, contact our technical team:

 English
  Español
  Français
  Deutsch
  Русский
  العربية