
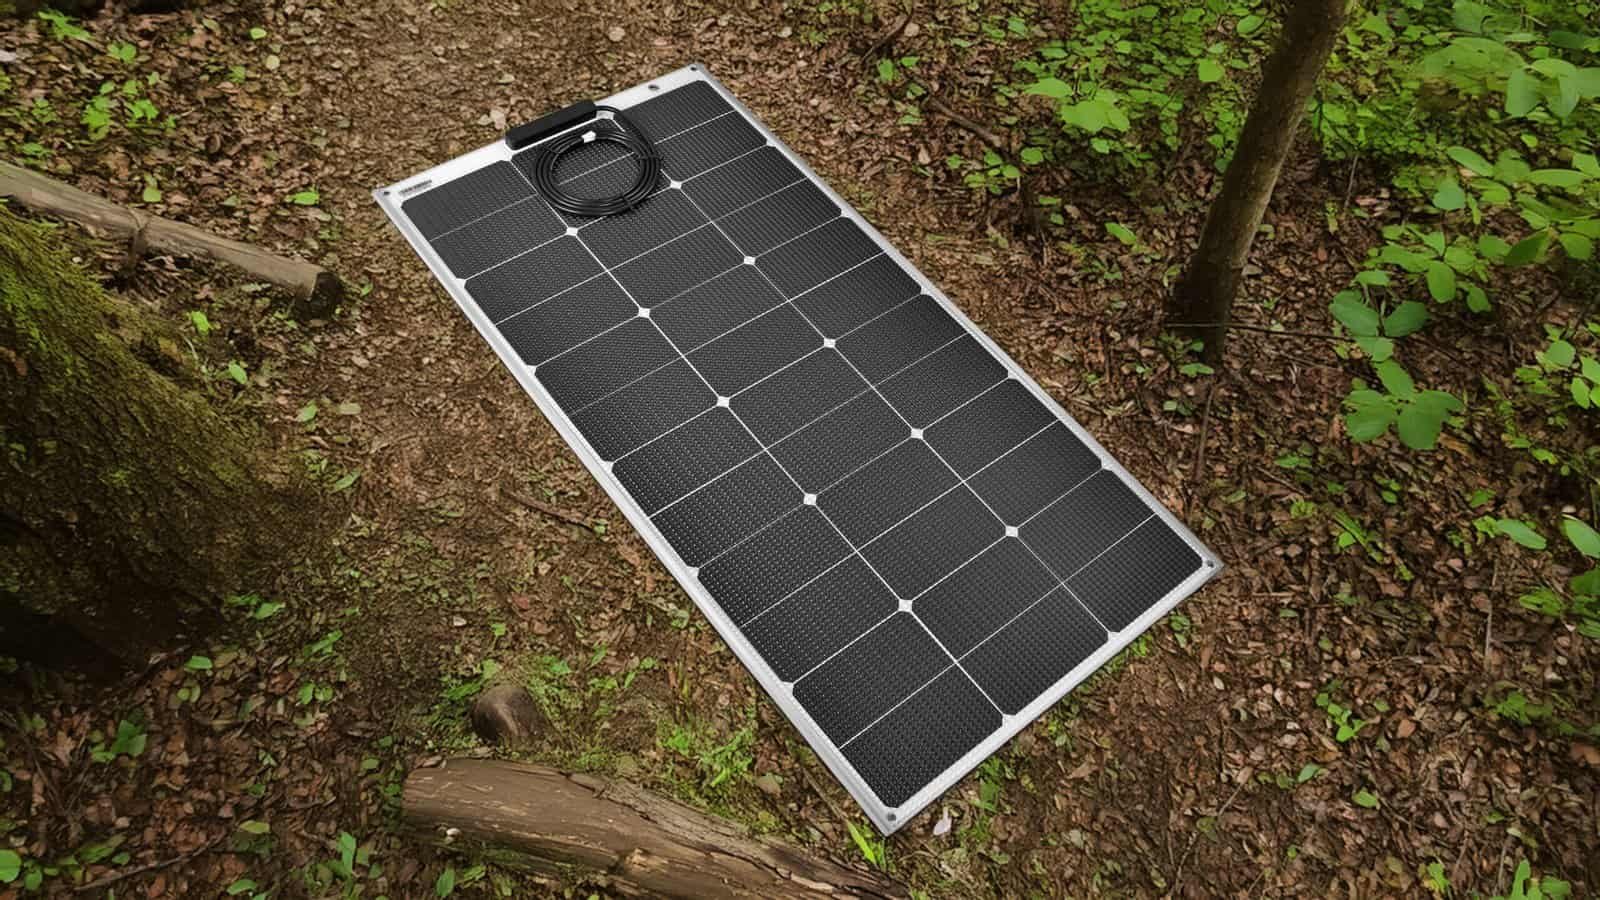
Un comprador OEM nos envió un correo electrónico el trimestre pasado con una pregunta muy interesante. La especificación de su celda indicaba una eficiencia de 26,2%. Su panel contenía 33 celdas de medio corte de aproximadamente 4,37 W cada una, lo que da un total de 144,2 W. Entonces, ¿por qué la etiqueta decía 130 W?
Catorce vatios, aparentemente desaparecidos.
No había nada malo con el panel solar. Esa brecha tiene un nombre, una fórmula y un conjunto de causas bien definidas: los ingenieros la llaman relación célula-módulo (CTM). Lo que sigue detalla los cálculos de un módulo solar real de 130 W con contactos posteriores de ETFE, le proporciona tres comprobaciones que puede realizar en cualquier hoja de datos en un minuto y resuelve una pregunta que nos hacen casi todas las semanas: ¿La capa de fibra de vidrio consume mucha energía?
Lo que realmente mide CTM
CTM compara dos valores: la suma de las potencias de las celdas individuales, probadas mediante destello antes de la laminación, con la potencia nominal del módulo terminado en condiciones estándar de prueba (STC).
Una relación inferior a 100% es normal. La integración de celdas en un módulo añade película, adhesivo, espacios, conductores y resistencia, y cada uno de estos elementos tiene un pequeño coste.
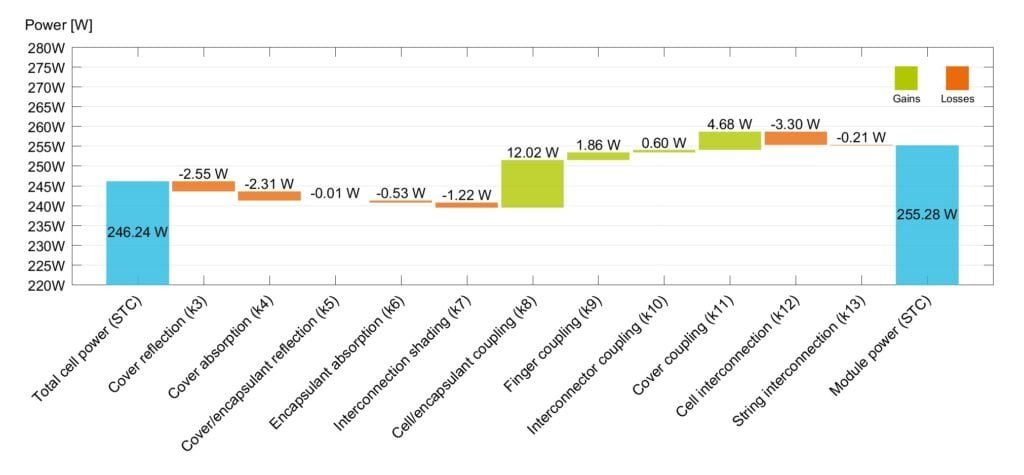
Lo que sorprende a los compradores es que CTM puede subir arriba 100%. Fraunhofer ISE ha construido módulos de media celda en 104% CTM mediante la ingeniería deliberada de ganancias ópticas en la pila. A escala industrial, el cruce ya se produjo: según los datos de ITRPV CTM superó la prueba de referencia 100% en 2021., con diseños de media celda por encima de 100,5% y diseños de tres cortes cerca de 101%.
En otras palabras, un módulo no es una caja que pierde luz. Es un sistema óptico, y algunas de sus partes devuelven energía.
La trampa: dividir la eficiencia del módulo por la eficiencia de la celda.
Un error se repite con más frecuencia en las hojas de cálculo de compras. Un comprador observa una eficiencia del módulo de 20,2% y una eficiencia de la celda de 26,2%, realiza la división, obtiene 77,1% e informa que la fábrica está perdiendo 23% en la laminación.
La cifra es errónea, y la razón es estructural más que aritmética. La eficiencia de la celda se mide sobre el área de la celda; la eficiencia del módulo se mide sobre todo el panel. Un panel presenta bordes, espacios entre celdas y espacio para el enrutamiento; nada de ello genera energía, y nada de ello debe incluirse en la cifra de pérdida por laminación.
La relación correcta
Eficiencia del módulo = Eficiencia de la celda × Cobertura del área activa × Relación CTM
Si separamos los dos efectos, las cifras dejan de parecer sospechosas. Uno es la geometría, determinada por el diseño; el otro es la física de la integración, determinada por el proceso. Agruparlos oculta el único que realmente se puede negociar.
Un ejemplo práctico: 130 W de contacto trasero flexible
Tomemos como ejemplo un producto real: un módulo flexible de ETFE con contactos posteriores de 1090 × 590 mm, con 33 celdas de medio corte en una matriz de 3 × 11, con una potencia nominal de 130 W en condiciones estándar de prueba (STC).
| Paso | Cálculo | Resultado |
|---|---|---|
| Área celular completa | 182 × 183,75 mm | 0,0334 m² |
| Potencia total de la celda a 26,21 TP3T | 0,0334 × 1000 × 0,262 | ~8,75 W |
| Potencia de la celda reducida a la mitad | 8,75 ÷ 2 | ~4,37 W |
| Suma de 33 semicélulas | 33 × 4,37 | 144,2 W |
| Potencia nominal del módulo | Hoja de datos, STC | 130 W |
| relación CTM | 130 ÷ 144,2 | 90.2% — una brecha de 14,2 W |
A continuación, la geometría. Cada semicelda mide aproximadamente 91 × 183,75 mm, por lo que 33 de ellas cubren aproximadamente 0,552 m². El panel abarca 0,643 m². Por lo tanto, la cobertura activa se sitúa cerca 85.8%.
Multiplica los tres juntos:
26,2% × 85,8% × 90,2% = 20.3%
La hoja de datos indica 20,2%. Se trata de un redondeo, no de una discrepancia.
Recomendamos esta conciliación a todos los compradores, ya que es rápida y difícil de falsificar. Si las tres cifras de un proveedor no coinciden con una diferencia de apenas unas décimas, algo no cuadra: una eficiencia de celda inflada, un área incorrecta o una ficha técnica copiada del producto de otro fabricante.
Dos sutilezas que oculta la aritmética
Chaflanes. Un rectángulo de 182 × 183,75 mm tiene una diagonal de 258,6 mm y no cabe en un lingote de 252 mm, por lo que la oblea huésped es pseudocuadrada. El área real de la celda se encuentra ligeramente por debajo del rectángulo y el CTM medido se sitúa unas décimas por encima. La identidad se autocorrige: al reducirse el área de la celda, la cobertura disminuye mientras que el CTM aumenta, sin afectar la eficiencia del módulo.
Tolerancia. Una tolerancia de 0 a +3% sitúa la placa de características en la parte inferior de la distribución de producción, por lo que cualquier CTM derivado de la etiqueta subestima el rendimiento de la línea.
Dos controles más y ninguno necesita ir al laboratorio.
La conciliación de la eficiencia es la prueba definitiva. Estos dos métodos tardan un minuto en detectar de inmediato las hojas de datos falsificadas.
Voltios por celda. Divida los voltajes del módulo por el número de celdas: 20,13 V ÷ 33 = 0,61 V a máxima potencia, 23,45 V ÷ 33 = 0,71 V en circuito abierto. Ambos valores corresponden al silicio del contacto posterior. Si el resultado es de 0,5 o 0,9 V, o bien el número de celdas es incorrecto o los datos eléctricos son inventados.
Densidad de corriente. Divide la corriente de cortocircuito entre el área activa de una celda; en una cadena en serie, cada celda transporta la misma corriente. Aquí: 6,77 A ÷ 167,2 cm² = 40,5 mA/cm².
El techo de la física
Richter, Hermle y Glunz establecen el límite intrínseco para el silicio cristalino de unión simple en 43,31 mA/cm² — Una celda ideal de 110 µm con perfecta captura de luz y sin metalización frontal. Ningún otro módulo fabricado en silicio la supera. Con 40,5 mA/cm², este módulo alcanza aproximadamente el 94% de ese límite: ajustado, pero legal, y consistente con una celda de contacto posterior sin líneas de rejilla frontales.
Trátelo como una línea roja. Una hoja de datos que indique más de aproximadamente 43 mA/cm² no es optimista; es imposible. Hemos visto cifras citadas que superan los 46. Una advertencia: cuando las celdas están dispuestas en grupos en paralelo en lugar de una sola cadena en serie, divida primero la corriente del módulo por el número de cadenas en paralelo.
¿Dónde van realmente los 14 vatios que faltan?
Ese 9,8% no es una sola cosa. Son al menos seis, y solo algunas de ellas involucran luz.
| Mecanismo | Causa | ¿Se puede solucionar en la fábrica? |
|---|---|---|
| Corte celular | Recombinación y microdaños en el borde de corte. | Sí — método de separación, pasivación de bordes |
| Óptica frontal | Reflexión y absorción a través de la pila frontal | Sí, grado del material, calidad de laminación |
| Interconexión | Calentamiento por infrarrojos en conductores y uniones traseras. | Sí — sección transversal del conductor, integridad de la junta |
| Desajuste | 33 celdas en serie; la más débil determina la corriente. | Sí, una clasificación más estricta. |
| Caja de conexiones y cable | Resistencia del diodo y del cable | En parte, pequeño, pero real. |
| Ganancias ópticas | Acoplamiento de índice y luz reciclada desde las capas posteriores | Sí, y este también. agrega fuerza |
Esa última fila explica por qué no se puede estimar el CTM multiplicando los valores de transmitancia de las hojas de datos de cuatro proveedores. El modelo de Fraunhofer registra las ganancias y las pérdidas en el mismo libro mayor, no en una cadena de restas.
Separación de las pérdidas ópticas de las pérdidas eléctricas
Seis mecanismos en un solo número no son de mucha utilidad cuando se intenta reparar algo. Sin embargo, la división es sencilla y depende del parámetro que afecte cada mecanismo. Las pérdidas ópticas consumen fotones, por lo que se reflejan en la corriente. Las pérdidas eléctricas afectan el voltaje y el factor de llenado, y dejan la corriente prácticamente inalterada.
Por lo tanto, solicite datos de flash en ambos lados de la laminación y calcule dos proporciones:
- Isc del módulo ÷ Isc de la celda es su CTM óptico. La reflexión de la lámina frontal, la absorción del encapsulante y la dispersión de la fibra de vidrio, todo converge aquí.
- El resto Se encuentra en Voc y factor de llenado: resistencia de interconexión, desajuste y recombinación de borde de corte.
La distinción es importante desde el punto de vista comercial. En el caso de la óptica, la discusión se centra en los materiales: peso de la fibra, grado del encapsulante, número de capas. En el caso de la electricidad, los materiales no son determinantes; la conversación se centra en el diseño del conductor, la clasificación y el proceso de separación. Los proveedores que no pueden proporcionar ambos conjuntos de datos de memoria flash generalmente no los miden.
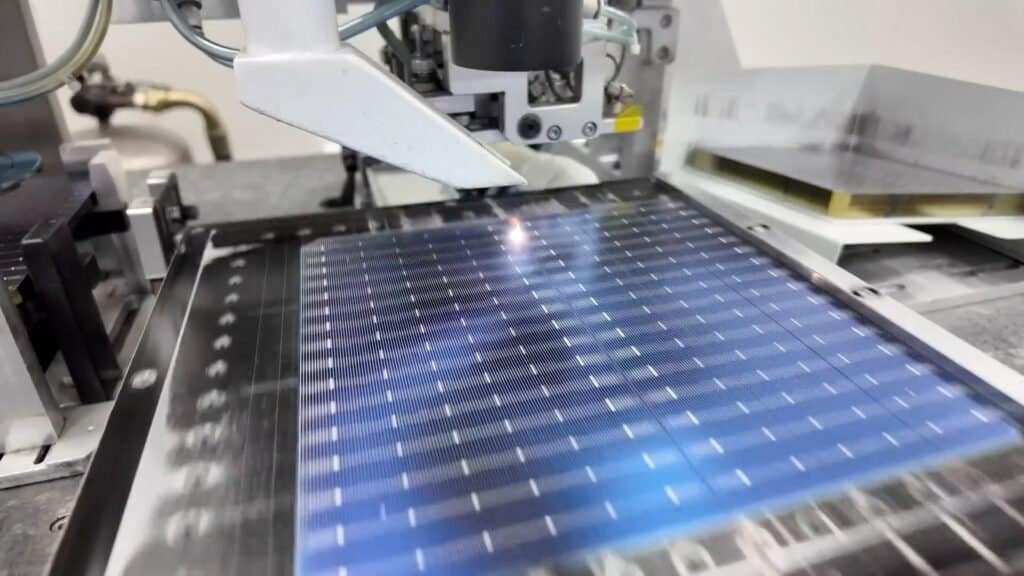
El corte merece una nota aparte, porque el enfoque popular lo interpreta al revés. La construcción con medio corte es una clara ventaja neta: reduce a la mitad la corriente y la pérdida resistiva se cuadruplica, lo que vale 3 a 5% más potencia que los equivalentes de células completas. La verdadera pregunta es cuánto devuelve el proceso de separación. No mucho, si se hace bien: Fraunhofer ISE informa sobre los costos de la separación láser térmica optimizada solo ligeramente por encima de 0,1% en términos absolutos de eficiencia, con la pasivación de los bordes recuperando aproximadamente el 85% de eso. Las rutas de marcado y rotura más baratas dejan mucho más daño, daño que se manifiesta más tarde como grietas bajo carga.
¿La fibra de vidrio bloquea la luz? La respuesta sincera
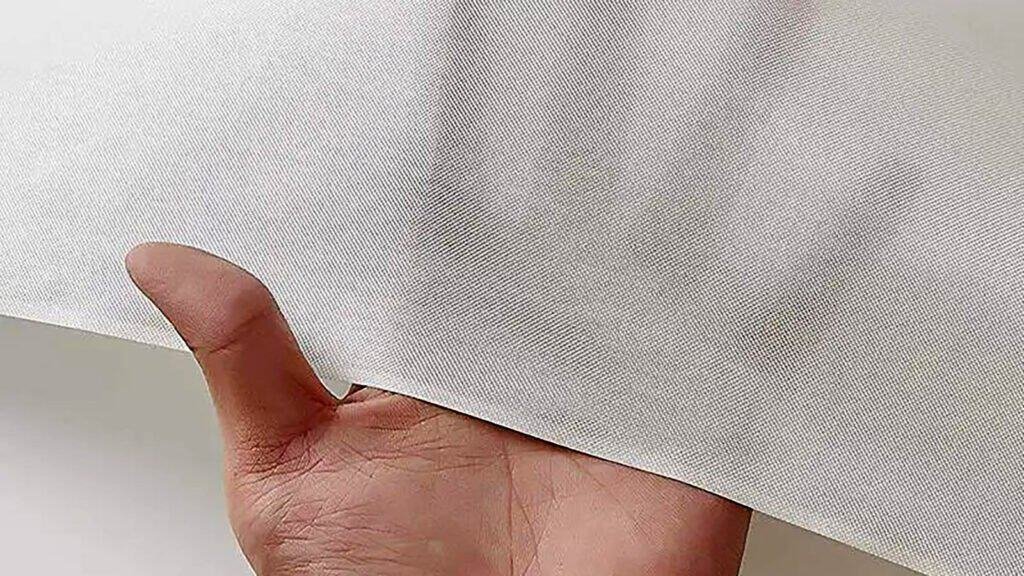
Si se toma una lámina de fibra de vidrio seca, se ve blanca, opaca y sin vida. Los compradores la identifican en un diagrama de capas y concluyen que el panel está desperdiciando una décima parte de la luz solar. El instinto es razonable. Sin embargo, en general, es erróneo.
La fibra de vidrio seca se ve blanca porque las fibras están rodeadas de aire. El vidrio E tiene un índice de refracción cercano a 1,56, mientras que el aire tiene un índice de refracción de 1,00, y esta diferencia dispersa la luz en cada uno de los millones de límites de las fibras. La laminación al vacío cambia las reglas del juego. El encapsulante inunda el espacio entre las fibras, y el EVA de grado fotovoltaico y el POE tienen un índice de refracción cercano a 1,48. La diferencia en el índice de refracción se reduce drásticamente de aproximadamente 0,56 a aproximadamente 0,08, y la dispersión disminuye considerablemente.
Sin embargo, translúcido no es transparente. Ese residuo de 0,08 es precisamente la razón por la que la cantidad de fibra sigue siendo la variable determinante. Como lo expresó el equipo de la EPFL responsable del estudio más citado sobre este tema: incluso una pequeña discrepancia entre la fibra y la matriz reduce la transmitancia, y la penalización aumenta con el peso del refuerzo.
Desde el campo
Hemos visto a más de un comprador rechazar una construcción reforzada tras examinar una muestra seca. Juzgar una capa impregnada por su aspecto en seco es un error costoso. Solicite una muestra laminada.
Los datos: la transmitancia disminuye con el peso de la fibra.
Investigadores de la EPFL encapsularon células fotovoltaicas bajo láminas de fibra de vidrio con un peso de refuerzo creciente y luego midieron la corriente de cortocircuito frente a las células sin recubrimiento. El patrón es inequívoco.
| Peso de refuerzo | Irradiancia que llega a la célula |
|---|---|
| Ninguno (mera referencia) | 100% |
| 410 g/m² | 88% |
| 820 g/m² | 83% |
| 1230 g/m² | 81% |
| 1640 g/m² | 75% |
| 3280 g/m² | 63% |
Fuente: Pascual y otros, EPFL, CISBAT 2013. Los valores son relaciones de corriente de cortocircuito en el rango de 300 a 800 nm.
La arquitectura de las fibras apenas se registró: el patrón de tejido influyó en la lectura en un pequeño porcentaje, y el peso total de las fibras en decenas. El tejido cruzado resultó ligeramente inferior al unidireccional, lo que los autores atribuyeron a las bolsas de aire atrapadas donde se cruzan las fibras.
Léalo en sentido figurado, no literalmente.
Esos cupones se fabricaron a mano con resina de poliéster sobre celdas de silicio amorfo en el rango de 300 a 800 nm. Su producto está laminado al vacío con POE o EVA sobre silicio cristalino, que responde más allá de los 1100 nm. La resina del estudio se ajustó al índice de refracción de las fibras a 1,56, algo que no ocurre con los encapsulantes fotovoltaicos. tendencia Las transferencias se realizan sin problemas; las cifras absolutas no.
Nótese el extremo inferior: incluso a 410 g/m², mucho más pesado que los velos utilizados en los paneles fotovoltaicos flexibles, la transmitancia se mantuvo en 88%. Por lo tanto, la pregunta útil nunca fue "¿este panel contiene fibra de vidrio?". Es ¿Cuántos gramos por metro cuadrado, en qué lado y hasta qué punto estaba impregnado?
La posición de la capa determina el costo.
La mayoría de los laminados flexibles se construyen simétricamente, con el mismo refuerzo por encima y por debajo de la celda, lo que mantiene el conjunto equilibrado e impide que el panel se curve al enfriarse. Sin embargo, ópticamente, las dos capas no tienen casi nada en común. Solo una queda expuesta a la luz solar.
| Capa | Posición | Efecto sobre la CTM |
|---|---|---|
| Lámina frontal de ETFE | Frente, más externo | Pequeñas pérdidas por reflexión superficial y absorción leve |
| Encapsulante (EVA / POE) | Ambos lados | Pequeña pérdida en el frente; el acoplamiento del índice recupera algo. |
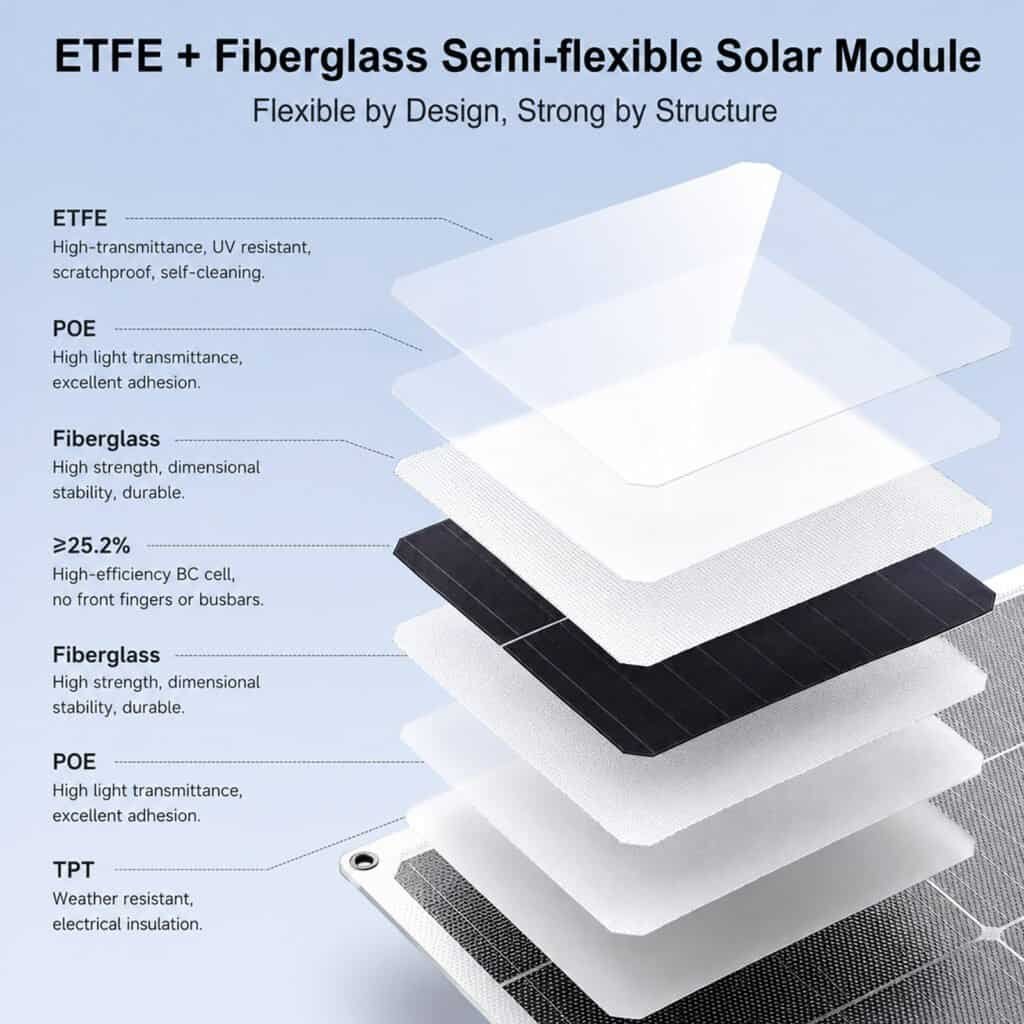
| Membrana compuesta (CPC) | Delantero y trasero | La parte delantera consume luz; la parte trasera puede reflejarla. |
| Refuerzo de fibra de vidrio | Frente | Modesto una vez impregnado; escala con peso de fibra |
| Refuerzo de fibra de vidrio | Trasero | Coste óptico casi nulo; función mecánica |
| Lámina posterior (TPT / KPF) | Trasera, la más externa | Sin pérdida directa; una película de color claro añade reflexión de huecos. |
Las capas traseras no son gratuitas, pero son baratas: dan forma a la reflexión interna en lugar de interceptar la luz incidente. Cuando el diagrama de un competidor muestra un refuerzo fuerte delante de La célula, que se construye de forma diferente, tiene un presupuesto óptico distinto al de una que lleva su estructura detrás.
¿Por qué los módulos flexibles parten con desventaja? Y no es por la fibra de vidrio.
Comencemos con las buenas noticias, porque el ETFE realmente gana una ronda. La hoja de datos del Norton ETFE de Saint-Gobain enumera: n = 1,40 y transmisión superior a 95%. Hagamos los cálculos de Fresnel: el aire refleja aproximadamente 2,81 TP3T, frente a aproximadamente 4,31 TP3T para el vidrio sin recubrimiento a 1,52. Sin recubrimiento, el ETFE deja pasar más luz.
Ahora vienen las malas noticias, por partida doble. El vidrio común no es sin recubrimiento: una capa antirreflectante reduce su reflectividad a aproximadamente 2%, eliminando la ventaja del ETFE frente al producto con el que realmente compite. Y esta segunda desventaja no aparece en ninguna ficha técnica. Reciclaje ligero Funciona por reflexión interna total: la luz que no incide en una célula se dispersa en las capas posteriores, golpea la lámina frontal desde el interior y, más allá del ángulo crítico, regresa para una segunda pasada hacia el silicio. Ese ángulo depende del índice de refracción de la lámina frontal; en este caso, un índice bajo resulta contraproducente. El vidrio con un índice de 1,52 produce aproximadamente 41°; el ETFE con un índice de 1,40 produce aproximadamente 46°.
Ángulo crítico más amplio, cono de escape más amplio, mayor cantidad de luz que se pierde por el frente en lugar de regresar a la célula. La misma propiedad que ayuda a la ida perjudica a la vuelta. Es un problema estructural —nada que ver con la fibra de vidrio, la cantidad de membranas o la habilidad de laminación— y una razón válida por la que un laminado flexible no igualará el rendimiento del vidrio con recubrimiento antirreflectante en CTM, por muy bien construido que esté. Las disposiciones densas de contactos posteriores lo agravan: con una alta cobertura de celdas, hay poca lámina posterior expuesta para dispersar la luz, por lo que una película trasera blanca absorbe menos vatios que en un módulo con contactos ampliamente espaciados.
La transmitancia total no es el número que usted desea.
Los proveedores ofrecen una sola cifra. Para un compuesto de fibra de vidrio, una sola cifra no es suficiente: un laminado puede pasar la prueba 90% de la luz y aun así verse opaco, porque la luz llega dispersa. Eso es neblina, y se mide por separado.
La luz dispersa no se pierde automáticamente; un fotón que llega a la célula genera corriente independientemente del camino que haya tomado. Pero la neblina es un indicador fiable del control del proceso. El trabajo de la EPFL sobre módulos ligeros sin vidrio encontró Tanto EVA como POE transmiten alrededor de 90%. Desde aproximadamente 350 hasta 1100 nm, observándose que ciertas poliolefinas se vuelven lechosas después de la laminación, reduciendo la transmitancia y aumentando la reflectancia.
El aspecto lechoso indica una impregnación incompleta, aire atrapado o una laminación que no selló los huecos. En una estructura de fibra de vidrio, cualquiera de estos problemas restablece las interfaces vidrio-aire que se pretendía eliminar durante todo el proceso. Pregunte por el índice de turbidez. Este dato no solo refleja la calidad de la película, sino también el proceso de fabricación.
Cómo debe ser un buen CTM, según su formato.
Los puntos de referencia solo tienen sentido dentro de un formato. Comparar un laminado flexible de ETFE con un módulo de vidrio en CTM por sí solo no mide lo que realmente importa.
| Formato | CTM típico | Por qué |
|---|---|---|
| Vidrio convencional, medio cortado | >100.5% | Cristal AR, interconexión madura, reflexión de espacio diseñada |
| Vidrio convencional, de tres cortes | ~101% | Menor corriente aún, por lo tanto, menor pérdida resistiva. |
| Paneles fotovoltaicos integrados en edificios (BIPV) de doble vidrio | ~97–100% | El cristal trasero renuncia a la ganancia de dispersión de la lámina posterior blanca. |
| ETFE flexible, reforzado | ~88–94% | Panel frontal de polímero multicapa, sin cristal antirreflejos, cono de escape más amplio. |
| ETFE flexible, pila mínima | ~92–96% | Menos capas por encima de la célula, menor protección mecánica. |
A continuación se muestran las cifras del módulo de vidrio. Datos de la hoja de ruta de ITRPV. Los rangos flexibles reflejan nuestros propios datos de fabricación y estudios publicados sobre la integración de módulos; se trata de directrices de ingeniería, no de especificaciones certificadas.
Una advertencia antes de solicitar estos presupuestos a un proveedor.
Ninguna norma IEC define cómo debe informarse el CTM. La norma IEC 61215 regula la potencia del módulo y la IEC 60904 la medición de la celda, pero la relación entre ambas no está estandarizada. La comparación solo tiene sentido una vez que ambas partes coinciden en la base: qué datos flash, qué bin, antes o después del corte.
Considere la tabla como una compensación, no como un marcador. Un módulo flexible sacrifica varios puntos de CTM a cambio de peso, radio de curvatura y resistencia a las grietas; en el techo de una autocaravana o una cubierta curva, esta compensación es la razón de ser del producto. Un valor de alrededor de 90% es aceptable. Un valor declarado de 99% en la misma estructura debería ser motivo de preocupación.
Cómo aislar el costo de la fibra de vidrio usted mismo
No se necesita un laboratorio de investigación: bastará con cuatro cupones y un espectrofotómetro con esfera integradora. Lamine cuatro muestras libres de células utilizando su receta de producción:
| Cupón | Construir | Pregunta respondida |
|---|---|---|
| A | ETFE + encapsulante | Costo base de la hoja frontal |
| B | Membrana compuesta A+ | ¿Cuánto cuesta la membrana? |
| C | B + fibra de vidrio | El delta de fibra de vidrio (C ÷ B) |
| D | Pila frontal completa | Presupuesto óptico total |
Mida la transmitancia total, la transmitancia directa, la turbidez y la reflectancia en el rango de 300 a 1200 nm, y compárelas con la respuesta espectral de su celda. Un promedio de luz visible por sí solo puede ser engañoso, ya que el silicio es muy sensible al infrarrojo cercano. La relación C ÷ B es el valor que vale la pena discutir con el proveedor; todo lo demás es cuestión de opinión.
El espectrofotómetro te engañará con muestras turbias.
La mayoría de los planes de prueba pasan esto por alto. El equipo de la EPFL descubrió que una vez que aumenta la dispersión, no toda la luz dispersada vuelve a entrar en la esfera integradora, por lo que el instrumento lee bajo, y el error aumenta con el peso de la fibra. Su conclusión: las mediciones de corriente de cortocircuito en una celda encapsulada dan valores más precisos para laminados más gruesos. Para cualquier muestra que parezca lechosa, lamine una celda de referencia debajo y mida Isc contra una celda sin encapsular. Confíe más en eso que en la esfera.
Doce preguntas antes de realizar un pedido OEM.
- ¿Qué es el? mesurado ¿Potencia de media celda después del corte, no la potencia de la celda completa reducida a la mitad?
- ¿Qué método de separación utiliza y están pasivados los bordes cortados?
- ¿Cuál es la potencia de flash promedio de sus módulos y cuál es la amplitud de la dispersión de los datos?
- ¿Coinciden la eficiencia de la celda, la cobertura activa y el CTM con la eficiencia del módulo que usted ha declarado?
- ¿La corriente de cortocircuito dividida por el área activa de una celda se mantiene por debajo de ~43 mA/cm²?
- ¿Podría facilitarme los datos de flash de ambos lados de la laminación para que pueda separar la pérdida óptica de la eléctrica?
- ¿Cuál es el peso superficial de la fibra de vidrio en g/m², tanto en la parte delantera como en la trasera por separado?
- ¿El encapsulante es EVA, POE o EPE? ¿Y la hoja de datos coincide con las especificaciones de la línea de productos?
- ¿Podría facilitarnos los datos de turbidez y transmitancia del conjunto frontal laminado, no de las películas sin procesar?
- ¿Qué contenido de gel o ventana de laminación mantienen, y cómo se verifica lote a lote?
- ¿El refuerzo está delante de la célula, detrás de ella o en ambos lados?
- ¿Puedo ver una imagen EL de un panel de producción del mismo lote que mi muestra?
La pregunta 8 revela más problemas que las demás juntas: muchas hojas de datos aún mencionan el EVA porque nadie actualizó una plantilla escrita hace años. La pregunta 2 es la que menos esperan los proveedores, y una respuesta vaga revela mucho sobre todo lo que sucede después.
Conclusiones clave
- CTM compara la potencia del módulo con la suma de las potencias de las celdas. Un valor inferior a 100% es normal; actualmente, el vidrio convencional supera este valor.
- Nunca divida la eficiencia del módulo por la eficiencia de la celda; eso mezcla la geometría con la pérdida de integración.
- Eficiencia del módulo = eficiencia de la celda × cobertura activa × CTM. Úselo como auditoría de consistencia.
- Divida la corriente Isc del módulo por el área activa de una celda. Por encima de ~43 mA/cm², la hoja de datos es imposible, no optimista.
- Divida el voltaje del módulo por el número de celdas. El silicio de contacto posterior proporciona ~0,61 V en Vmp, ~0,71 V en Voc.
- La relación Isc aísla la pérdida óptica; lo que queda se encuentra en Voc y el factor de llenado, y es eléctrico.
- Aproximadamente, 90% CTM es adecuado para un laminado de ETFE flexible reforzado.
- La fibra de vidrio se vuelve translúcida una vez que el encapsulante llena los huecos; translúcida, no transparente. El peso superficial es determinante; el patrón de tejido apenas importa. Solo el refuerzo de la cara frontal reduce considerablemente la cantidad de luz.
- El bajo índice de refracción del ETFE reduce la reflexión en la primera superficie, pero amplía el cono de escape, por lo que los paneles flexibles reciclan menos luz que el vidrio antirreflectante. Esta diferencia es estructural.
Preguntas frecuentes
¿Cómo calculo la relación entre celdas y módulos?
Divida la potencia nominal del módulo en condiciones estándar de prueba (STC) entre la suma de las potencias medidas en pruebas de flash de cada celda que contiene, y luego multiplique por 100. Para el ejemplo de 130 W: 130 ÷ 144,2 = 90,2%. Utilice datos medidos de media celda siempre que sea posible; derivar la potencia de la celda a partir de una cifra de eficiencia nominal proporciona una aproximación, no una medición.
¿Cuál es una buena proporción de celdas por módulo para un panel solar flexible?
Para un módulo de ETFE reforzado, un valor aproximado de 88–94% es realista. Los módulos de vidrio ahora superan los 100% gracias al vidrio con recubrimiento antirreflectante, la interconexión avanzada y un mejor reciclaje de la luz, que recupera más de lo que pierde. Compare un panel flexible con otros paneles flexibles.
¿Por qué la eficiencia de mi módulo es mucho menor que la eficiencia de la celda?
Dos razones independientes. Parte del área del panel no contiene silicio, y las pérdidas de integración reducen la potencia que sí produce el silicio. En el ejemplo anterior, la cobertura representó aproximadamente 14% y la CTM aproximadamente 10%.
¿La fibra de vidrio reduce la producción de los paneles solares?
El refuerzo de fibra de vidrio en la cara frontal tiene un coste óptico. La magnitud de este coste depende del peso superficial y la calidad de la impregnación, no de la mera presencia de fibra de vidrio. El refuerzo en la cara posterior prácticamente no conlleva un coste óptico directo.
¿Una pila cortada a la mitad tiene exactamente la mitad de potencia que una pila completa?
Casi, pero no. El corte crea nuevos bordes donde los portadores se recombinan, por lo que las mitades juntas miden ligeramente menos que la original. La separación láser térmica optimizada cuesta alrededor de 0,1% en eficiencia absoluta, y la pasivación de bordes recupera la mayor parte de esa pérdida.
¿CTM es una especificación certificada?
No. La potencia del módulo se rige por la norma IEC 61215 y la medición de celdas por la norma IEC 60904, pero ninguna norma regula cómo se informa la relación. Cualquier valor de CTM debe considerarse una declaración de cualificación, no un valor certificado.
Analice sus propias cifras
Cada laminado es un desafío. Se negocia el peso de la fibra con la resistencia al agrietamiento, el número de capas con el presupuesto óptico, el radio de curvatura con la rigidez. No existe una configuración universalmente correcta, solo la adecuada para el montaje del panel y las condiciones a las que está sometido.
Envíenos una hoja de datos —de cualquiera— y realizaremos la auditoría descrita en este artículo comparándola con ella. Voltaje por celda, densidad de corriente frente al límite físico y conciliación de la eficiencia. Recibirá tres cifras y nuestra opinión sobre si coinciden. Sin compromiso, y le informaremos si las cifras de la competencia son válidas.
Coulee fabrica módulos flexibles de contacto posterior de ETFE, módulos rígidos BC y sistemas BIPV de doble vidrio para distribuidores, instaladores, compradores OEM y promotores en Norteamérica y Europa: diseños, tamaños y voltajes personalizados, etiquetado privado y pruebas con cantidades mínimas de pedido bajas.
Correo electrónico: info@couleenergy.com
Teléfono: +1 737 702 0119
Web: couleenergy.com
Fabricación OEM y ODM · Cantidad mínima de pedido baja · Tamaño, potencia y forma personalizados · Muestreo rápido
Fuentes y lecturas adicionales
- Fraunhofer ISE — CTM 100+: mejora del rendimiento del módulo mediante el análisis de las pérdidas entre celdas y módulos.
- Fraunhofer ISE — Software de análisis de celda a módulo SmartCalc.CTM / SmartCalc.Module
- Richter, Hermle y Glunz, Revista IEEE de Energía Fotovoltaica (2013) — Reevaluación de la eficiencia límite para células solares de silicio cristalino (Límites intrínsecos de 29,431 TP3T y 43,31 mA/cm²)
- Plásticos de alto rendimiento Saint-Gobain — Propiedades típicas de la película de fluoropolímero Norton® ETFE (índice de refracción, transmisión)
- Pascual, de Castro, Schueler, Vassilopoulos & Keller (EPFL, CISBAT 2013) — Transmitancia total de luz de laminados de polímero reforzado con fibra de vidrio
- Lisco, Virtuani y Ballif (EPFL, UE PVSEC 2020) — Optimización del encapsulante de la lámina frontal para módulos fotovoltaicos ligeros sin vidrio.
- Lohmüller y otros (Fraunhofer ISE, SiliconPV 2025) — Separación de células solares TOPCon de baja pérdida mediante TLS y pasivación de bordes con Al₂O₃.
- revista pv — Optimización láser para células solares de medio corte
- TaiyangNoticias — Ganancias y pérdidas a nivel de módulo (datos de celda a módulo de ITRPV)


 Español
  English
  Français
  Deutsch
  Русский
  العربية